How Can We Help?
Search for answers or browse our knowledge base.
Reports – Deeper Dive
Purpose
Across many different software platforms there are usually multiple ways to achieve the same or similar result. Within the Aparavi Platform two there are two locations of running queries for finding more about your data, Reports and Files. The results are similar; however the Reports provides a breadth of options beyond the initial results.
This article will take Creating Custom Reports into a deeper look and give reason to why you would make some changes from the default results. The Creating Custom Reports knowledge base articles showed the basics in creating a report, however this will help find ways to give example as to why you would make certain customization changes to the report.
Example #1
As part of finding ROT (Redundant / Obsolete / Trivial) Data it is important to understand who might be impacted by removing the ROT Data. This example will create a report based on duplicate files but with the results grouping these files by user to see a breakdown of the number of files per user.
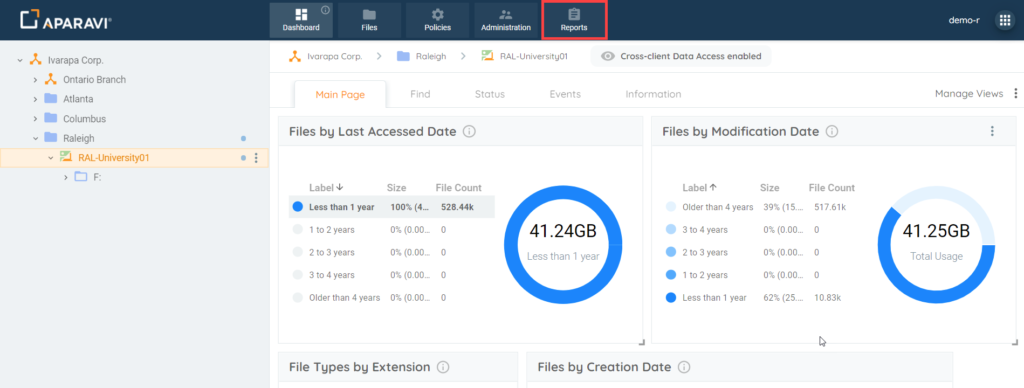
1. Click on the Reports tab, in the top navigation menu.
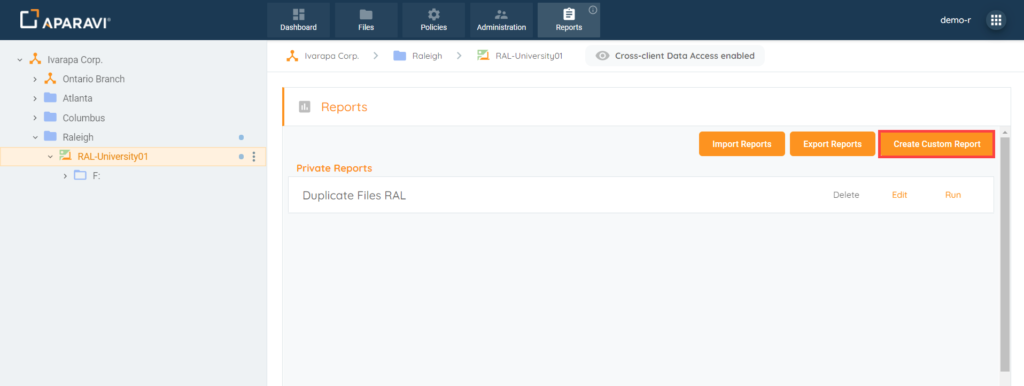
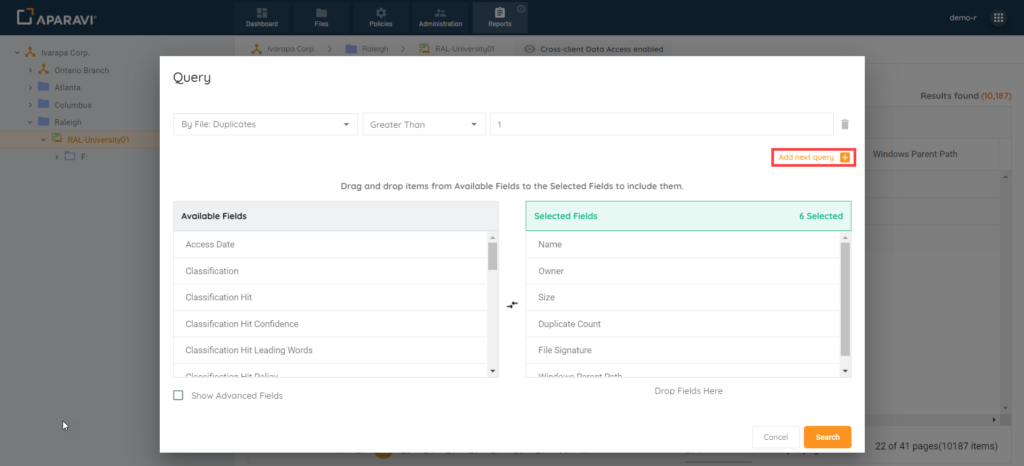
2. Click on the Create Custom Report button, located in the upper right-hand side of the screen. Once clicked, a Query pop-up box will display.
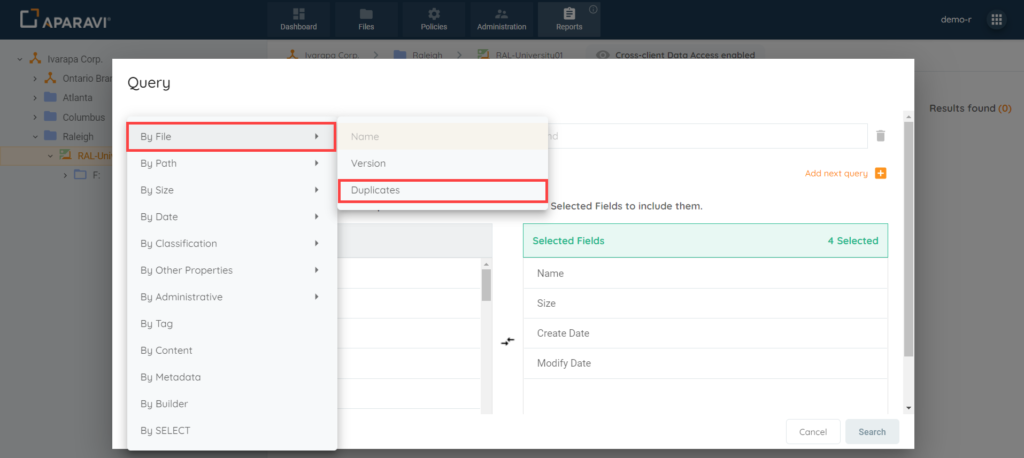
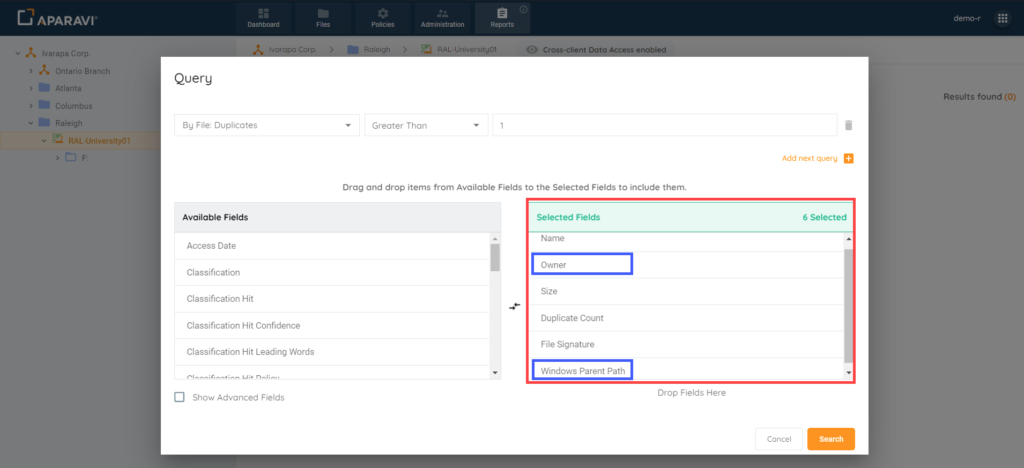
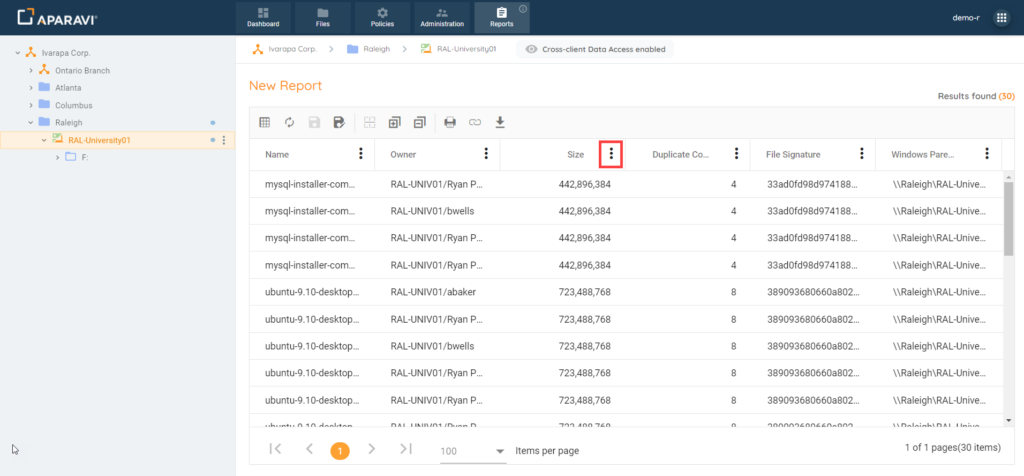
3. Inside the Query pop-up box, click on the first drop-down field and click on the first option listed, [By File]. A sub-menu will display, click on the Duplicates option. Once selected, the drop-down menus will close and [By File: Duplicates] will appear inside of the first drop-down field.
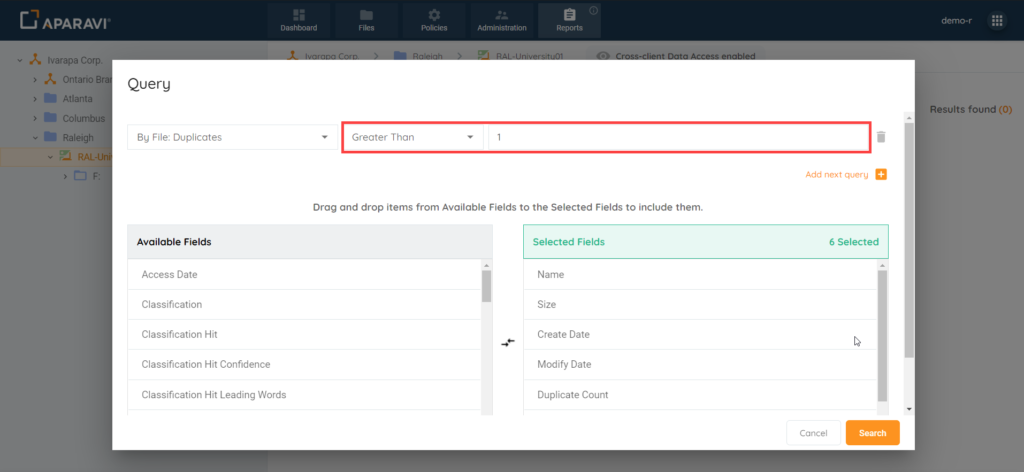
4. The next two boxes can use values that benefit the user running the report. For this example, [Greater Than] with a value of [1] will be used.
5. In this view the fields used in the report can be customized. For this Example, we will use:
-Name
-Owner
-Size
-Duplicate Count*
-File Signature*
-Windows Parent Path
*NOTE: Some Query Filters will add specific selected fields such as the two above, Duplicate Count and File Signature
6. Once the Search button is clicked, the Query pop-up box will close, and the report will run and display the results.
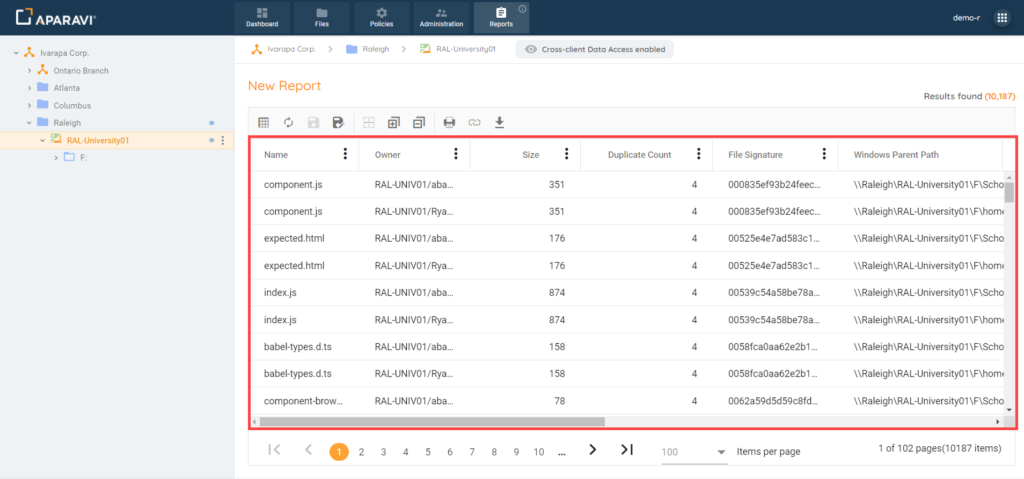
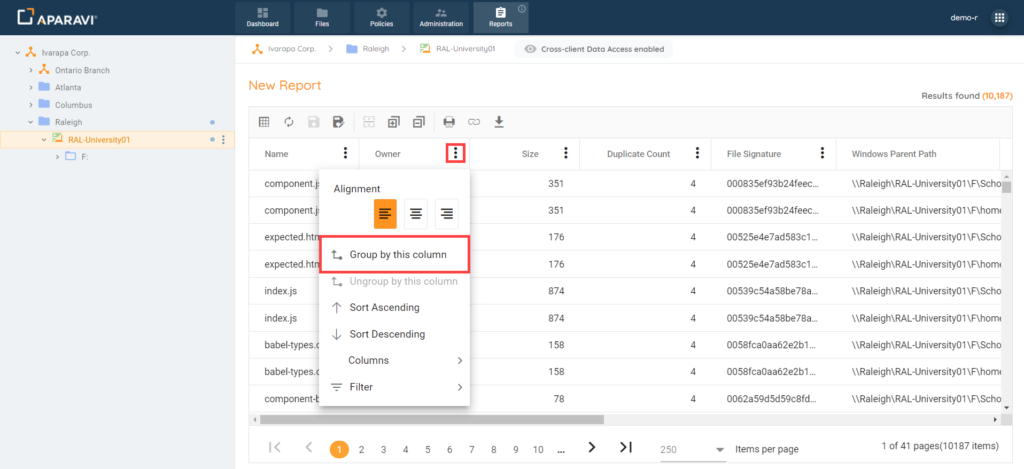
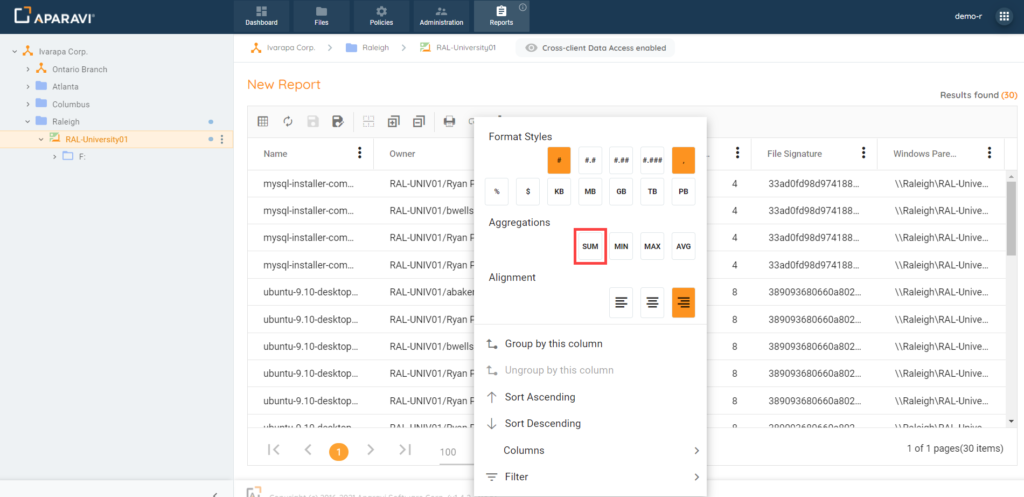
7. Once the results are populated full customization of the results can take place. For this example, we want to organize by Owner. To do this we will use the three dots on the Owner column and select [Group By This Column].
8. To quickly collapse all Owners, use the [Collapse All Groups] button in the Report toolbar.
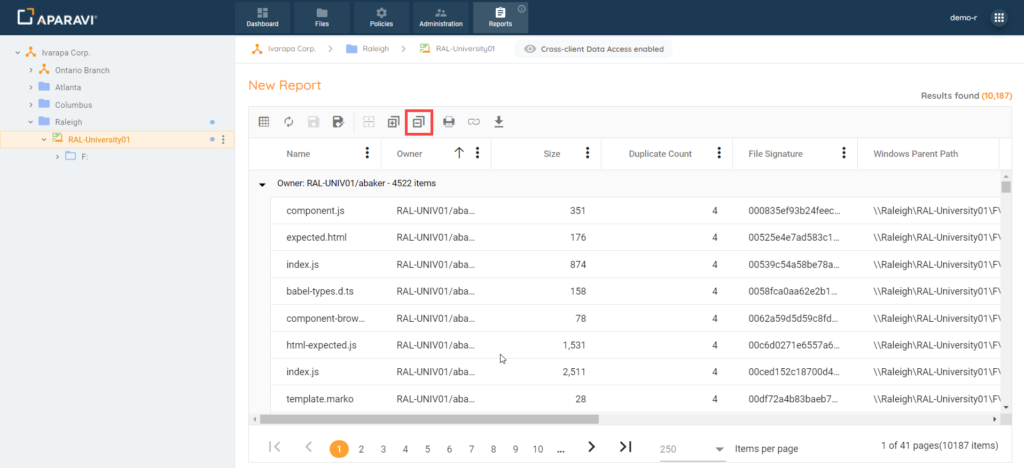
8. This now shows us a collapsed view of all the users with the number of duplicate files.
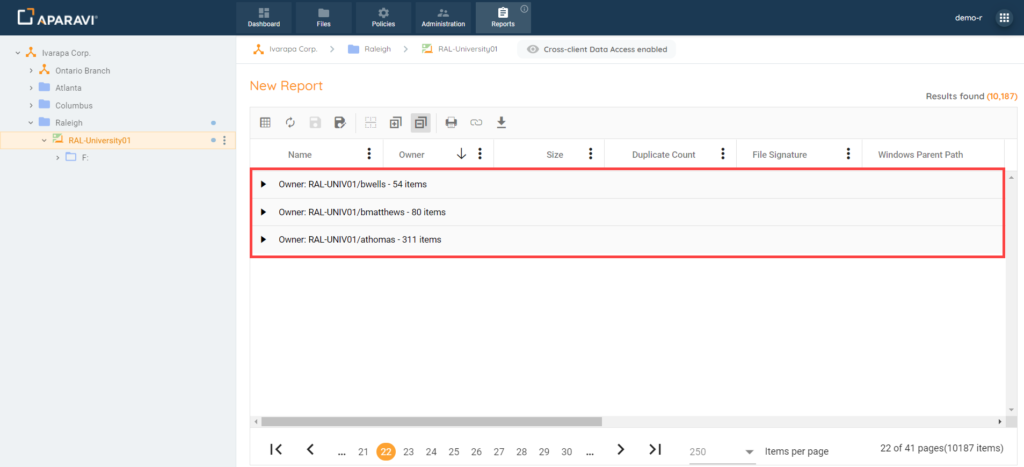
The results can now be used to pin-point locations of duplicate files and the location of the files. Further action can then be to reduce the ROT Data on the production file system, with the added Windows Parent Location column you know exactly where its located. Another option is to notify the users and have them cleanup the duplicate files to ensure nothing is accidently removed.
Example #2
Last example generated a report for Duplicate files which were then grouped by owner to see if there are any trends on users and duplicate files. Let’s run a similar report however on files over 300MB with more than one duplicate and find out the total amount of the results.
The feature of Reports used to do this will be the SUM, Group By This Column, and sorting columns to further organize the result. There are also options to be considered such as the measurement size such as looking at it in MB, GB, or TB.
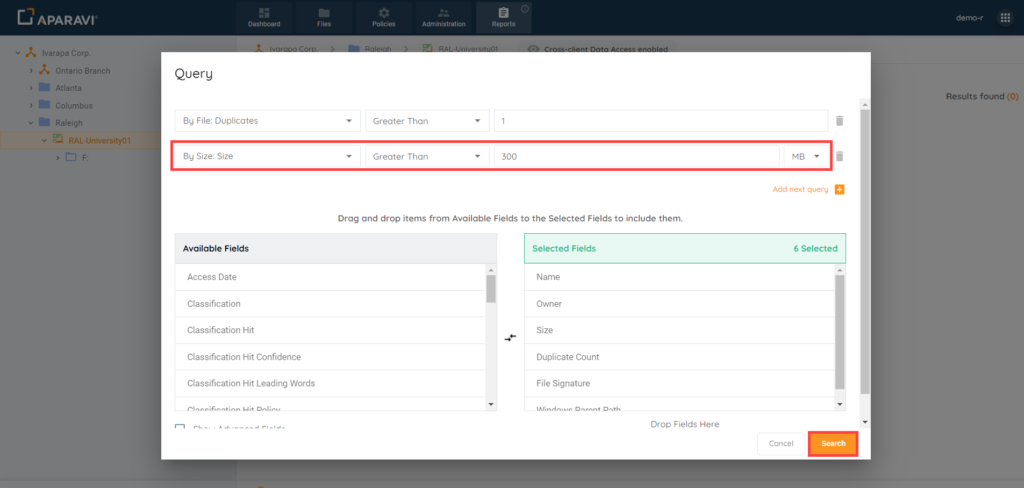
1. Edit the query for the current report.
2. Add a second query by clicking on [Add next query].
3. Select the first drop down and choose [By: Size], second drop down [Greater Than], for size in the text box [300], and the last drop down select MB. And then click the Search button to run the report.
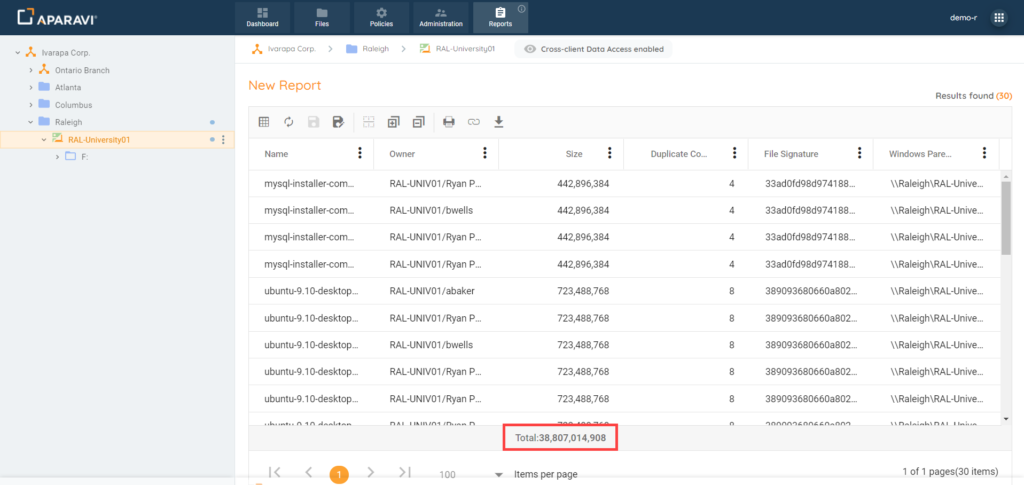
4. To find out the total amount of data that is duplicate click the three dots on the Size column.
5. Select [SUM] under the Aggregations. And at the bottom of the report there will be a total for the Size Column.
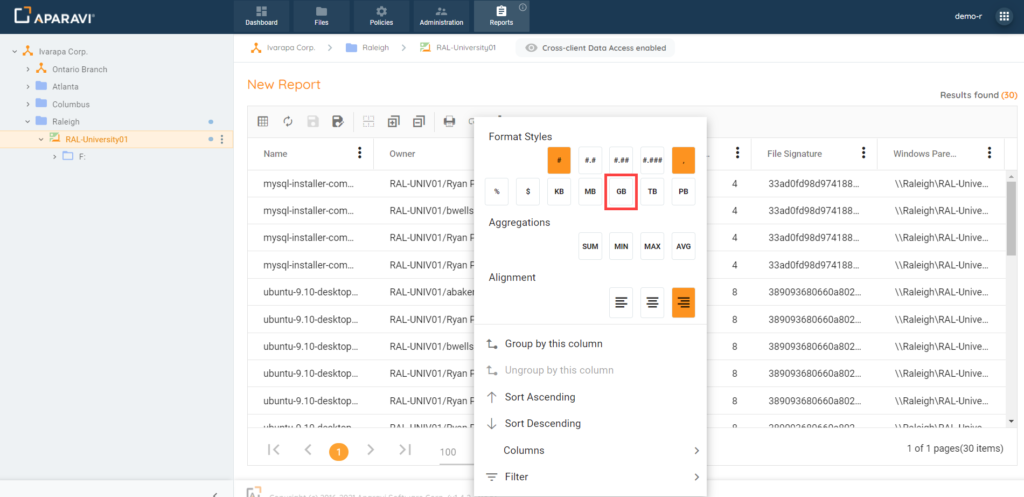
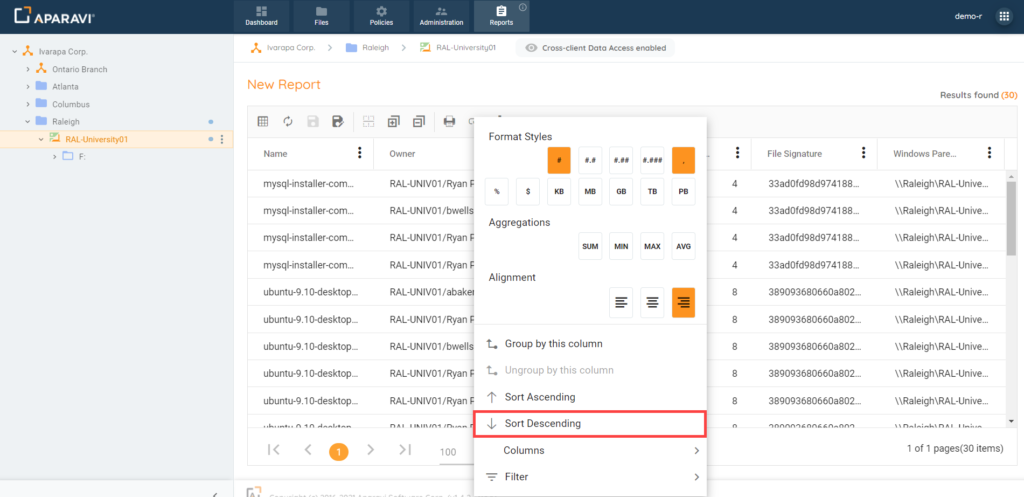
6. By default the Size is based on Bytes, but to see it in GB select the three-dots on the Size Colum and select [GB] under Format Styles.
7. It also might make sense visually to sort the Data, so again under the three-dots drop down on the Size column select [Sort Descending]. Now we can see the largest of the duplicate files at the top of the report.
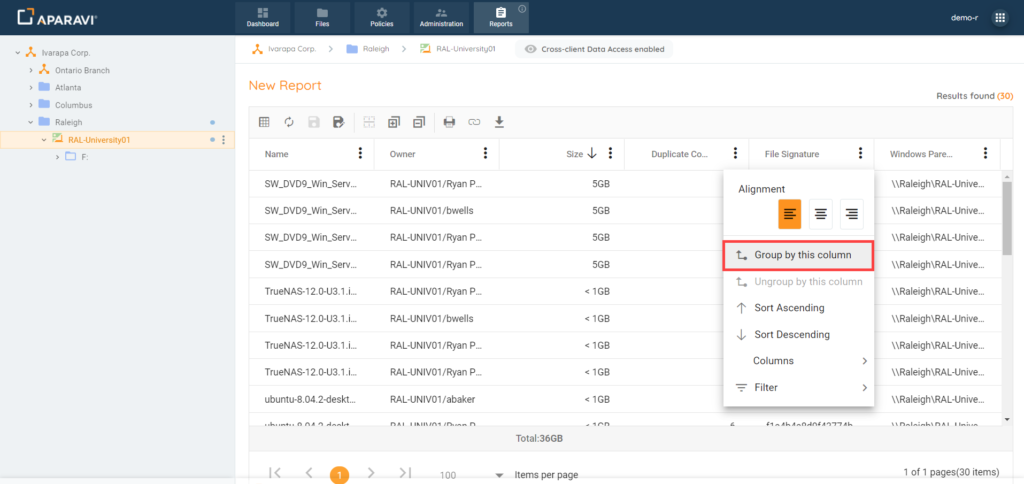
8. The File Signature is important as it recognizes the content of the file based on the hash to recognize that it is indeed duplicate. Group results in the report by File Signature using the three-dot drop-down in the header of the column and selecting [Group By This Column].
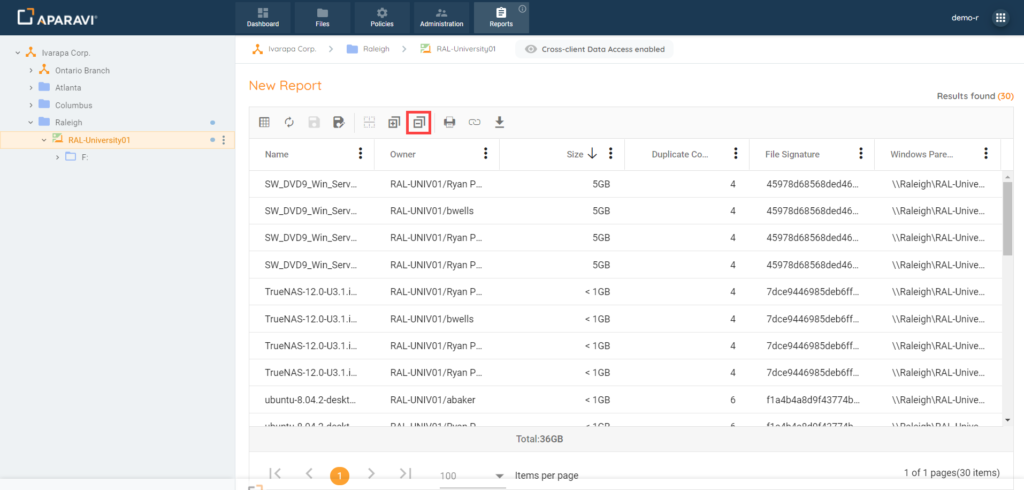
9. To collapse the groupings of File Signature the [Collapse All Group Items] button can be used in the Report toolbar. Now all the list looks more organized into less rows per File Signature.
10. If a File Signature group is expanded by the arrow to the left of the report entry it will then list the files that in this example that have the same file signature.
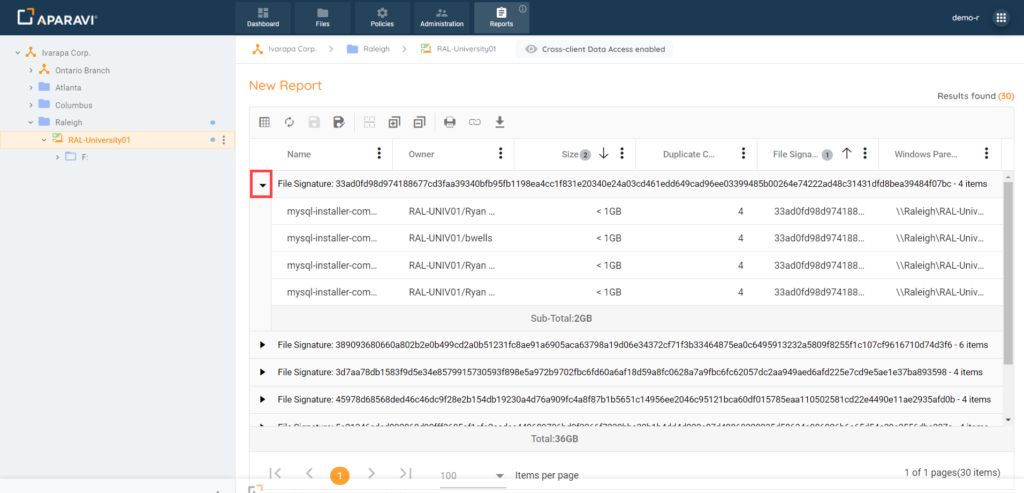
11. Lastly there is a sub-total for each grouping when expanded.
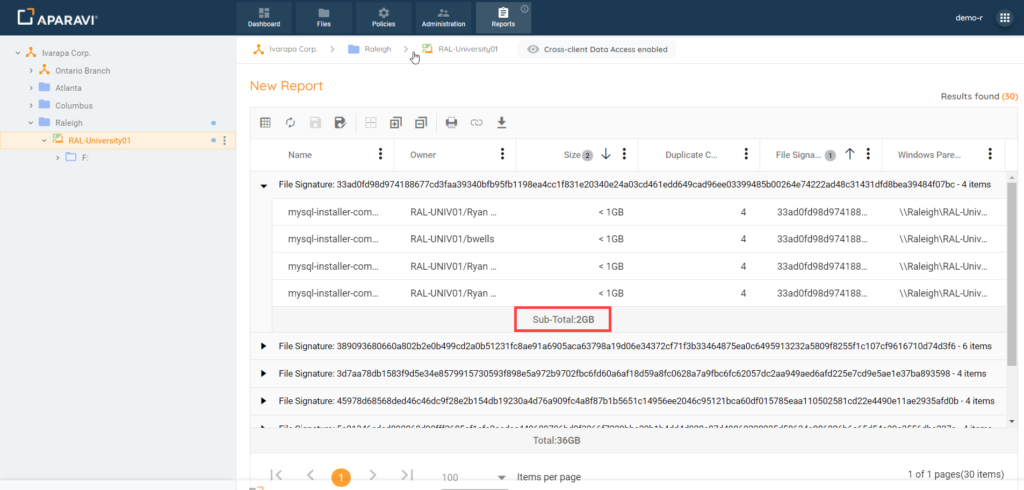
Running a report on Duplicate files over a certain size is beneficial to help narrow results to larger files that can certainly impact storage consumption. The example report above results were primarily ISO files ranging from 400MB up-to about 5GB, at a total of 38GB. By removing most of the duplicates there could be a significant savings in storage consumption, and adding other columns such as create or modify dates could help provide better judgment on removing any files, especially if the ISOs are obsolete based on age.
Conclusion
The two examples on how Reports shows more advanced options from the File search. There are similarities between the two on how the search queries are built. The key to where Reports can enhance the results is in the customization of the data. Grouping by like results helps see things like number of files for a user or the number of like items, and SUM can help put a number to the amount of data for those results for the entire result or individual groupings. Think about the data you are trying to uncover and track in your organization and how a customized report would help achieve desired results.