How Can We Help?
Search for answers or browse our knowledge base.
2.3 Release Notes
2.3 Release introduces new Dashboard widgets to deliver impactful insights on your first scan!
- Data Clean up and Cloud Migration Preparation
- Data Breach Prevention
- Projected Unstructured Data Growth
- Data Estate Insights
- Carbon Footprint and Cost Reduction
- Dashboard Configuration
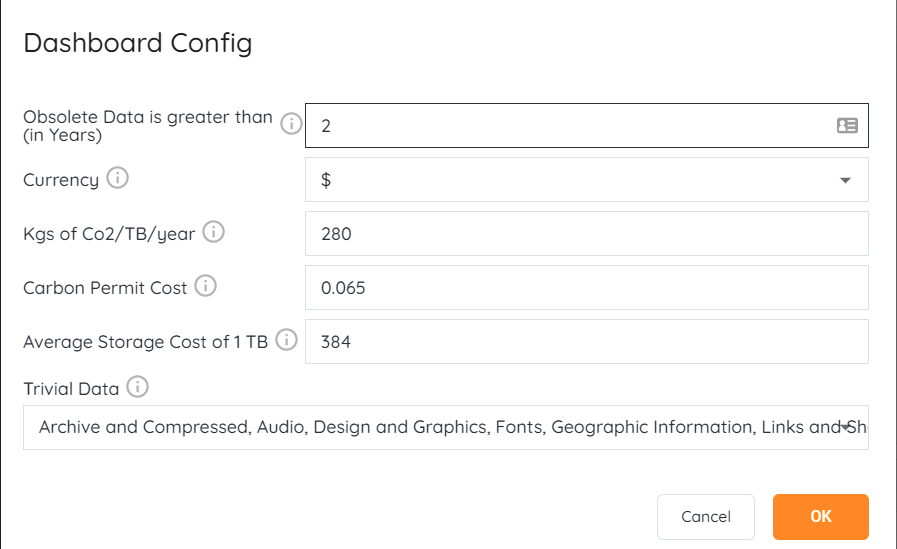
Dashboard Configuration
The dashboard widgets calculate insights depending on a wide range of variables.
Some values are dynamic, based on your actual data. (Growth rate, # of duplicates, # of Personal and Sensitive Data)
Other values are user inputted, based upon your company’s unique needs. The latter category can be modified and updated inside of the Dashboard Configuration modal.
“Obsolete Data”, Currency, Kgs of Co2/TB/Year, Carbon Permit Cost, Average Storage cost of 1 TB, and Trivial Data (File types).
Default values are based on internal surveys and research. You can modify this in the dashboard config widget based on your actual numbers.
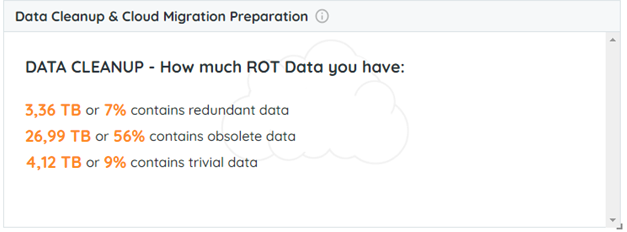
Data Cleanup and Cloud Migration Preparation
In any migration project, cleaning your data will lower cost and increase speed. This widget calculates an estimate so that users can begin the process of reducing ROT data (Redundant, Obsolete, and Trivial Data).
Redundant data is based on the percentage of duplicate data
Obsolete data is based on “old” data
Trivial data is based on “trivial” data types
You can customize your insights by editing these assumptions in the Dashboard Configuration Modal.
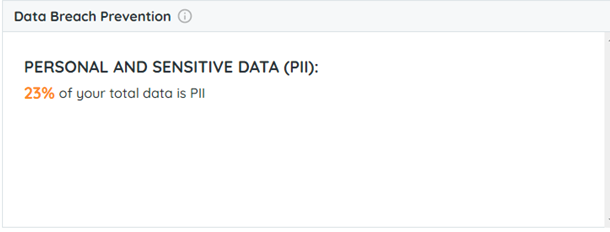
Data Breach Prevention
In this first iteration of Data Breach Prevention, this widget calculates and displays the amount of Personal and Sensitive Data (PII). This helps you identify risk early and prevent potential future emergencies.
The default value is based on surveys conducted with users and customers. Once a classification scan is completed on your environment, it will update to the actual values.
Please reach out to our customer success team if you’d like to learn more about the power of classifications!
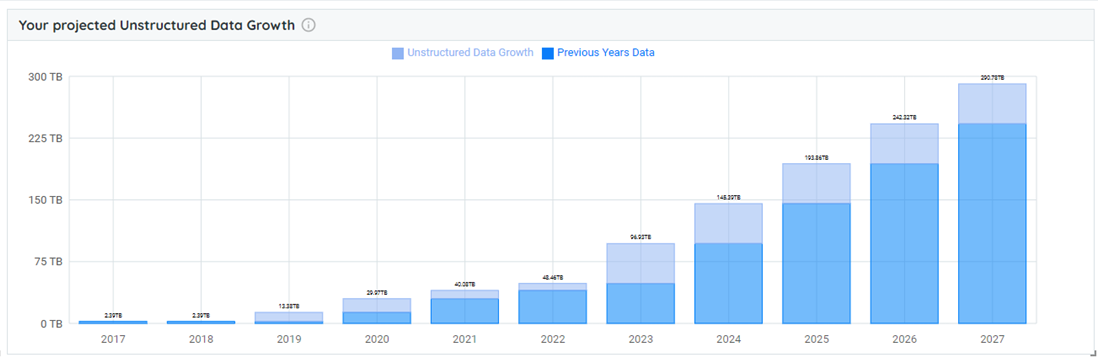
Projected Unstructured Data Growth
This is a helpful tool to forecast your data storage needs based on your actual data growth and usage. The widget computes based on last modified field (rather than created date) to reflect recent data activity such as when a file is copied.
The projected growth is calculated on a linear growth model based on the past 15 years of available data.
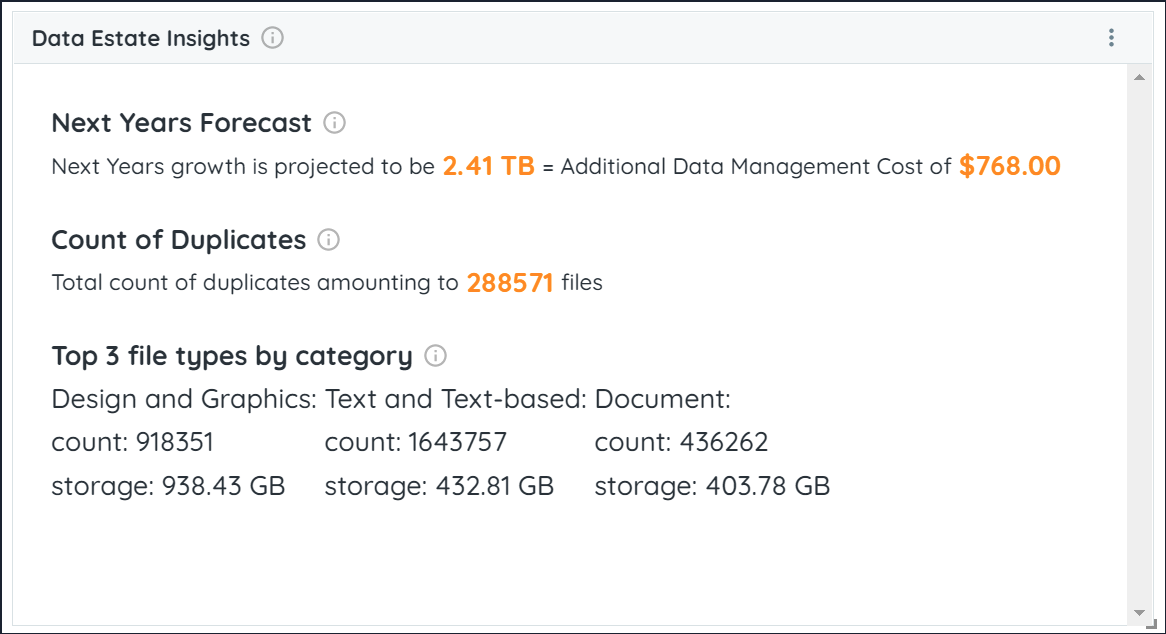
Data Estate Insights
This widget gives a high level overview of your data estate. It forecasts your growth and the associated cost, amount of duplicates in your system, and the top file types based on size.
Next Years Forecast is based on projected growth x’s average storage cost of 1TB.
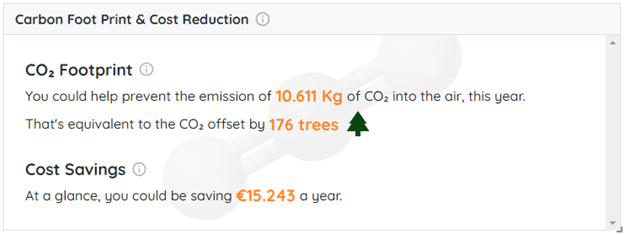
Carbon Footprint and Cost Reduction
ESG and carbon reduction is a growing concern globally and comprehensive ESG plans are now required in the European Union. This widget will give you a jump start by calculating the CO2 footprint and the potential cost savings if ROT data is removed.
CO2 Footprint KG = (Redundant + Obsolete + Trivial Data) * Kgs of CO2 per TB
Each tree can be offset by 60kg of CO2
Cost Savings = ( Co2 Footprint KG * Carbon Permit Cost) + ( Co2 Footprint KG * Average Storage Cost of 1 TB)